A lot of people open Excel to keep track of their expenses, organize work reports, or input figures from daily operations. What many don’t realize is that the same tool can help uncover insights hidden in those numbers. For marketers, researchers, analysts, and business owners, Excel is more than just a spreadsheet. It can help you measure how trustworthy your data is using confidence intervals.
At first, the term might sound too technical, but it is simply a smart way to measure how close your results are to the real picture. It tells you how much trust you can place in your numbers. If you work with survey responses, marketing performance, or financial reports, learning how to calculate confidence intervals gives your data more meaning. Excel makes the whole process less intimidating. No need to be a statistician or a math genius. A few clicks and your data will speak for itself.
What Confidence Intervals Actually Tell You
Before touching Excel, it is good to understand what a confidence interval actually is. A confidence interval is a range of values that gives you an idea of how reliable your result is. Instead of just showing a single number, it gives a high and low estimate around that number. For example, if your survey says 70 percent of customers are happy with a product and the confidence interval is between 67 and 73 percent, it means your true result likely falls somewhere in that range.
This range helps you see how reliable your data is. A narrow interval means your data is more precise. A wider interval means there may be more uncertainty in your sample. In real situations, confidence intervals are used in research, business forecasts, polls, and performance reports.
Why Confidence Intervals Are Important in Data Analysis
A lot of people think confidence intervals are only for researchers or scientists, but that is not true. They are useful in everyday work. If you run a business, it helps you know how reliable your customer survey results are. If you work in marketing, it helps you understand how much you can trust campaign results. If you work with financial data, it gives you a clear picture of how stable your numbers are.
For example, a small startup checking conversion rates may see a 10 percent increase. But a confidence interval can show if that increase is stable or if it might just be a random spike. That extra layer of understanding makes your data reliable and your decisions more informed.
What You Need Before Calculating Confidence Intervals in Excel
To calculate a confidence interval in Microsoft Excel, you need to have:
- A dataset or sample (for example, survey results, revenue figures, or performance scores)
- The sample size (how many observations or data points you have)
- The mean or average of your data
- The standard deviation (which measures how spread out your data is)
- The confidence level you want to use (most people use 95 percent, which means you are 95 percent sure the true value falls in the range)
Once you have these details, Excel makes the calculation process simple.
How to Calculate the Mean in Excel
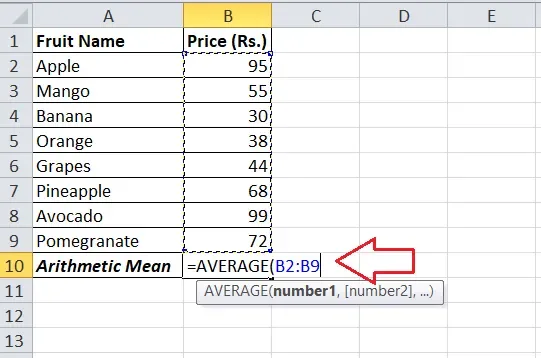
The mean is just the average of your numbers. To get this, you can use the AVERAGE function.
- Type =AVERAGE( then highlight the range of your data, for example =AVERAGE(A2:A20)
- Press Enter and Excel will give you the mean value of your dataset
The mean is your starting point for the confidence interval because it represents your central value.
How to Calculate the Standard Deviation in Excel
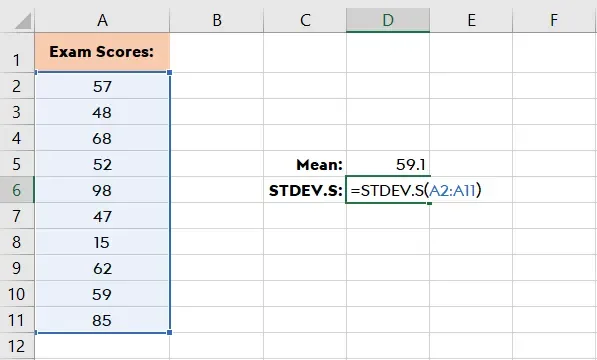
The standard deviation shows how spread out your numbers are. A smaller standard deviation means your data is clustered closely around the mean. A larger one means your data is more spread out.
- Use the STDEV.S function if you are working with a sample.
- Type =STDEV.S( then highlight your data range, for example =STDEV.S(A2:A20)
- Press Enter to get the result
This value will help you measure how much your data can fluctuate.
How to Choose Your Confidence Level
Most people use a 95 percent confidence level because it is the most common standard for surveys, reports, and research. It means you can be 95 percent confident that the true population value lies within your calculated range.
If you want a stricter estimate, you can use 99 percent. If you want a more flexible estimate, you can use 90 percent. The confidence level affects the width of your interval. A higher confidence level creates a wider interval. A lower confidence level creates a narrower interval.
How to Use Excel’s Built-in CONFIDENCE Function
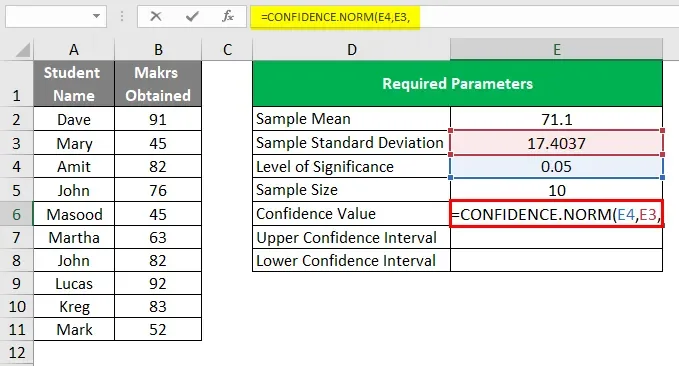
Excel has a built-in function that makes the calculation faster. The function is:
=CONFIDENCE.NORM(alpha, standard_dev, size)
- alpha is the probability of error, which is 1 minus your confidence level. For 95 percent confidence, alpha is 0.05.
- standard_dev is the standard deviation of your data.
- size is the number of data points in your sample.
Example:
=CONFIDENCE.NORM(0.05, 2.5, 50)
This will give you the margin of error. Once you have this, your confidence interval is:
- Lower bound = Mean minus Margin of Error
- Upper bound = Mean plus Margin of Error
This tells you how far above and below the mean your actual value might be.
How to Calculate Confidence Intervals Step by Step in Excel
Here is a simple step-by-step guide for anyone working with real data:
- Enter your data into a column (for example A2:A20).
- Use =AVERAGE(A2:A20) to get the mean.
- Use =STDEV.S(A2:A20) to get the standard deviation.
- Use =COUNT(A2:A20) to get the sample size.
- Use =CONFIDENCE.NORM(0.05, standard_dev, sample_size) to get the margin of error.
- Subtract the margin of error from the mean to get the lower bound.
- Add the margin of error to the mean to get the upper bound.
This gives you the full confidence interval for your dataset.
Many people get confused at the alpha step. If your confidence level is 95 percent, alpha is not 0.95. It is 0.05. Another common mistake is using STDEV.P instead of STDEV.S. STDEV.P is for an entire population. STDEV.S is for a sample.
Some people also forget to match their sample size correctly. If your data range is wrong or incomplete, your confidence interval will not be accurate. Another issue is rounding too early. Always use the exact numbers from Excel to avoid unnecessary errors.
When to Use Confidence Intervals
Confidence intervals are not just for big companies. They are useful in many everyday situations.
- Surveys: If you run a poll to know how many people like a new product, confidence intervals give you a reliable estimate of what the population might actually think.
- Marketing: If you measure conversion rates or ad performance, they help you know if the results are stable or just random.
- Finance: They help you check how much your returns or costs can fluctuate.
- Research and reporting: They show how accurate your findings are.
These use cases show why learning this skill in Excel can make your reports more meaningful. Numbers alone can be misleading if they are taken at face value. A percentage without context may look impressive but not be stable. A confidence interval gives that context. It tells you how much you can trust your result.
Why Excel is One of the Best Tools for This
Excel is popular because it is easy to use and widely available. You do not need expensive software or advanced coding skills to calculate confidence intervals. The functions are already built in, and the steps are simple enough for anyone with basic Excel knowledge. It is also great for quick analysis, which makes it a practical choice for small businesses, students, and teams that want reliable results without needing complex tools.
Confidence intervals give your data more depth and reliability. With Excel, you can calculate them in a few steps without getting lost in formulas or complex statistics. That extra insight is what often separates good reporting from great reporting.